 During
the BUBBLE IOP in Summer 2002 a series of SF
During
the BUBBLE IOP in Summer 2002 a series of SF
The tracer experiments were carried out in the city part called "Kleinbasel" where most of the near-surface measurements were focused during the IOP. The main urban station "Basel-Sperrstrasse" was centered in the tracer area (Sampling point 3 on the map). The city structure in this area is fairly homogeneous with a mean building height of approx. 15 m and a mean plan area density of 40%. For this city part a digital 3d building model is available.
During the IOP four successful tracer experiments were carried out on 26 June, 4, 7 and 8 July. All experiments lasted 3 hours with 6 integral 30 min samples at 12 different locations. The tracer units (samplers) were typically positioned 1.5 metres above the roofs. At the micrometeorological tower "Basel-Sperrstrasse" a tracer concentration profile was made within the street canyon. At "Basel-Messe" (Site 9 on the map) Tethered baloon profiles were measured during Experiments 1, 4 and 5.
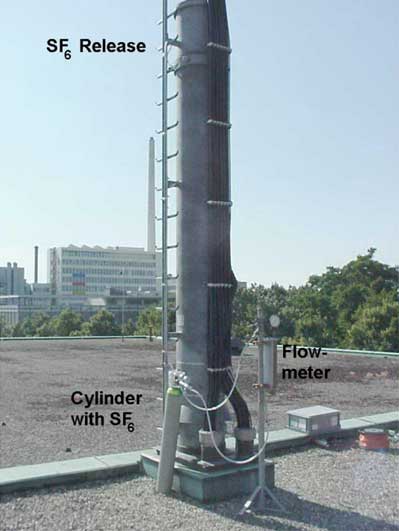
It was the aim to perform the tracer experiments under a thermally driven wind system called "Clarawind" that in the afternoon on cloud free summer days develops over Basel and is characterised by a persistent north-westerly direction of the wind. During experiment 1,4 and 5 (26 June, 7 and 8 July) the Clarawind developed. Therefore the release point "R1" in the North of the area was chosen. The release took place 3.8 metres above a roof of a parking deck at "Basel-Horburg".
Experiment
3 (July 4) was carried out under mechanically driven west winds.
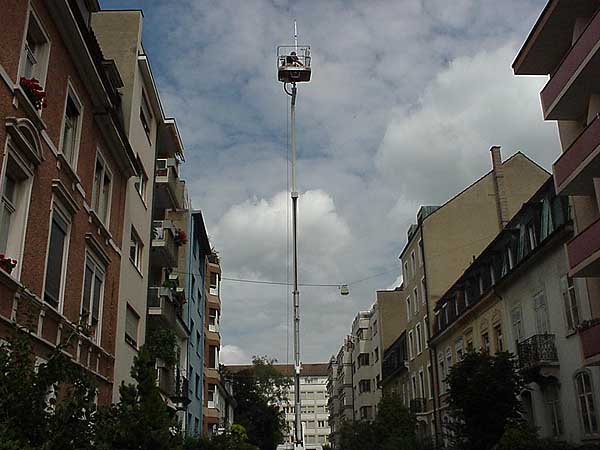
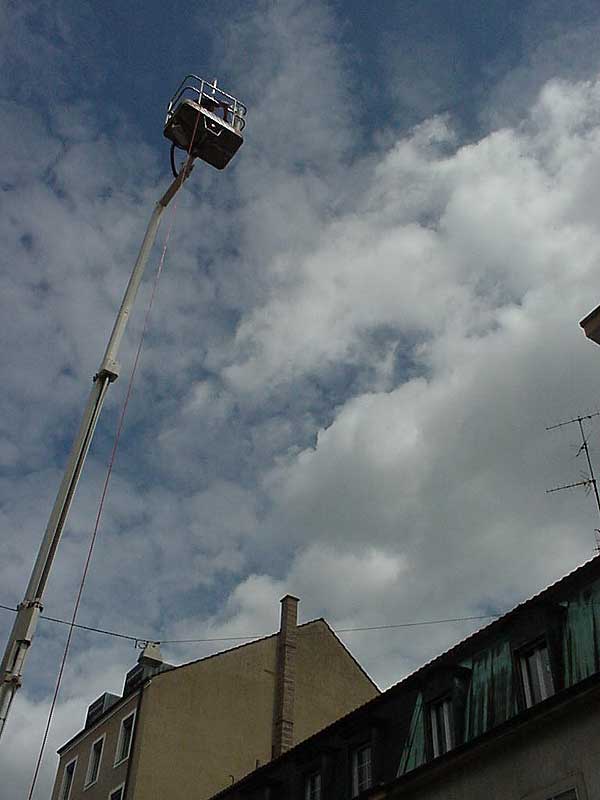
The tracer was released form a mobile hydraulic platform (R2 on the map). The release was
21 metres above the street.
Further, in the wind tunnel the tracer dispersion experiments will be remodeled. A comprehensive data set of tracer gas concentrations at various locations in the wind tunnel, including the full scale sampling locations, is expected to provide further insights in the turbulent dispersion during these experiments.
 |
 |
 |
| The standard release point in the North of the Area ("R1", at station "Basel-Horburg") on the roof of a parking building. | Release form the basket of a mobile hydraulic platform at the release point "R2" during experiment 3 (4.7.2002). | The samplers mounted at the micrometeorological tower at "Basel-Sperrstrasse" at 3 different heights from z/h=1.30, 0.75 and 0.23 down into the canyon. |
 |
 |
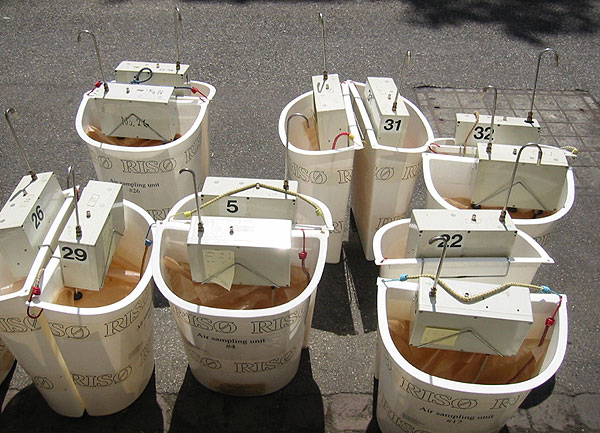 |
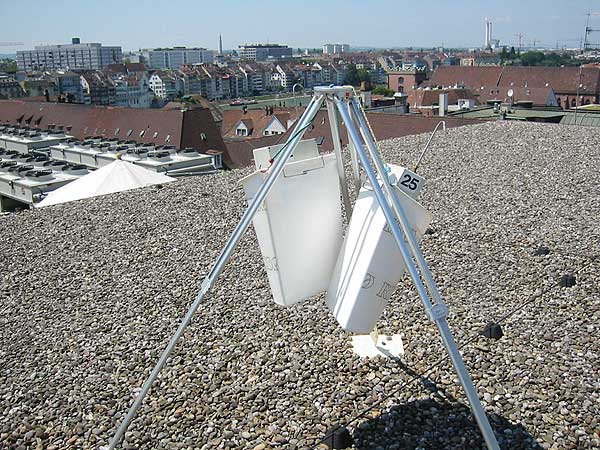
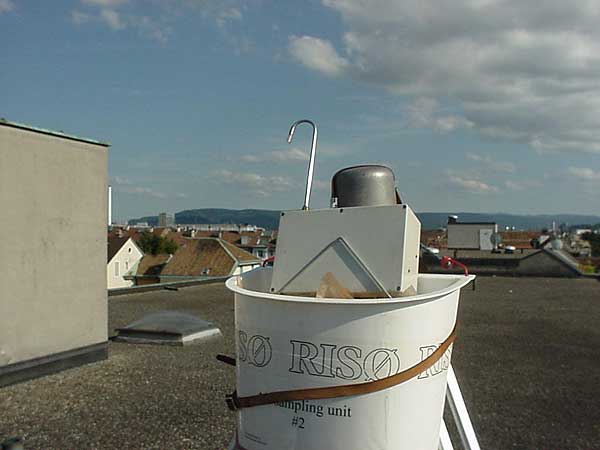
| Standard sampler at site 08. Most of the samplers are attached on tripods 1.5m above rooftop. | Each sampler sucks air through a metal tube into sampling bags that are inside the white basket. After 30 min the bags are changed. | |
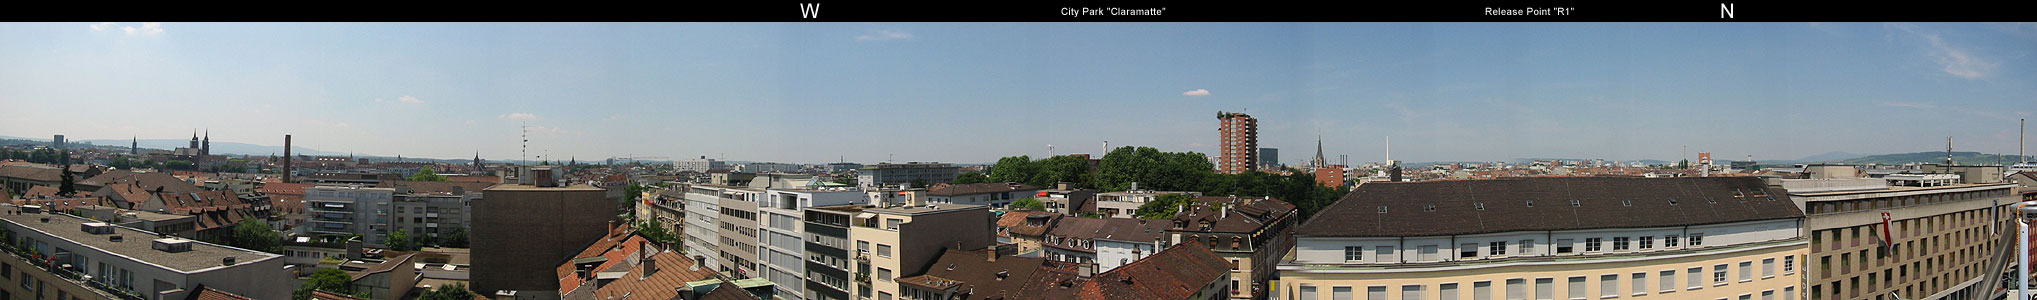
Panorama views from selected sampler sites
| 360° Panorama from the roof at the release point R1 ("Basel-Horburg"). |
| 180° Panorama from the roof at sampler site 02. |
| 360° Panorama from the tower at sampler site 3 ("Basel-Sperrstrasse"). |
| 360° Panorama from the roof at sampler site 6. |
 |
| 180° Panorama from the roof at sampler site 8. |
Photos by Andreas Christen, Jan Eitel, Eva van Gorsel, Irene Lehner, Mathias Müller and Gergely Rigo, University of Basel.
|
Report A detailed experiment experiment report is currently in work. Contact Mathias Rotach for additional information.
|
|
Maps of the Experiment Layout
Map
of all sampler locations during experiments 1 to 5 Map of tracer experiment 3 (July 4) Map of tracer experiment 4 (July 7) Map of tracer experiment 5 (July 8) Digital 3d building model Important notice: These digital maps (i.e. the base map) may not be reproduced or published without permission by the Grundbuch- und Vermessungsamt Basel-Stadt. Base maps: © Copyright GVA BS, 25.10.2002. |
|
| Meteorological
Conditions during the Experiment Days
|
|
| TV-Report
on BUBBLE-tracer experiments (22.08.2002, © SFDRS "MTW",
in german, 8min, real audio needed)
Wind tunnel modeling of the tracer experiments. |