![]()
ERS-2 SAR Data
ERS-2 SAR data were delivered geometrically corrected for terrain as GTC02 product. Images were geocoded (UTM zone 32) and provided with local incidence angle masks. Nominal pixel resolution is 12.5 m.
For satellite data analyses larger spatial extends were used than the size of the study site demanded to avoid numerical problems at the boundaries of the study area. All stages of satellite data preprocessing and analysis including the Landsat-5 TM data were handled in UTM zone 32 coordinates, while only the results were transformed to Swiss National Coordinates to reduce errors resulting from coordinate system transformation.
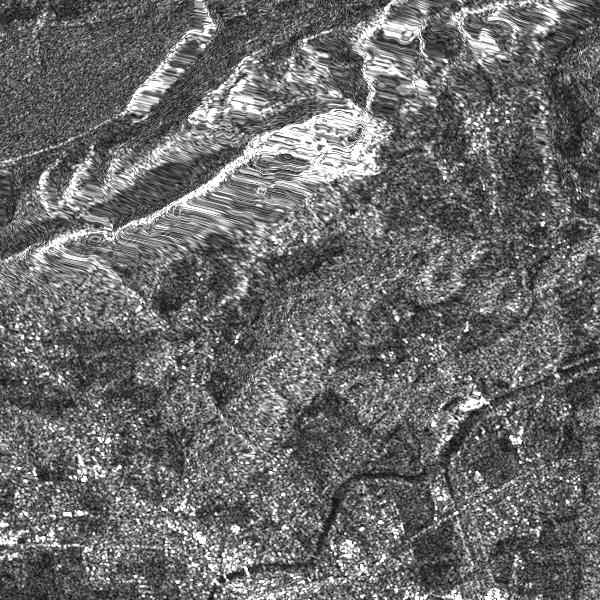
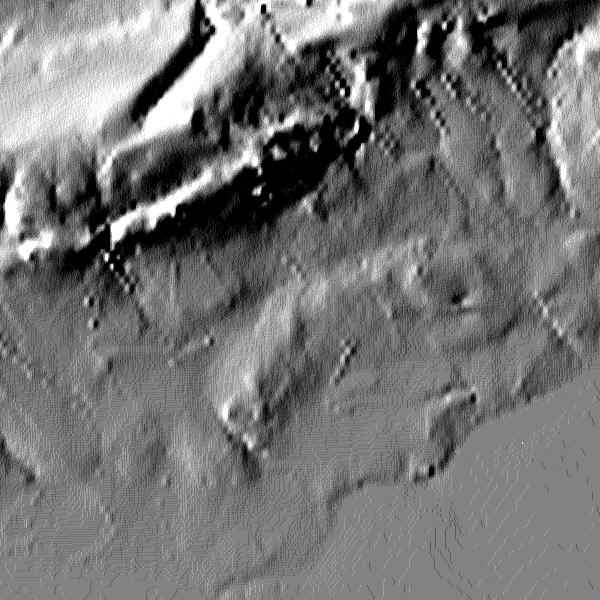
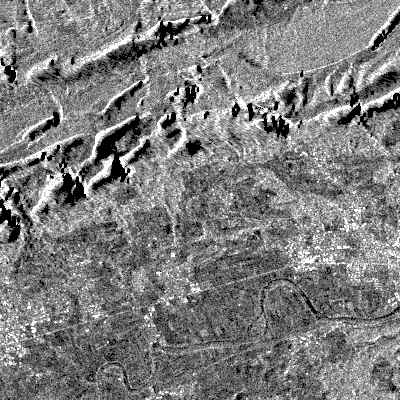
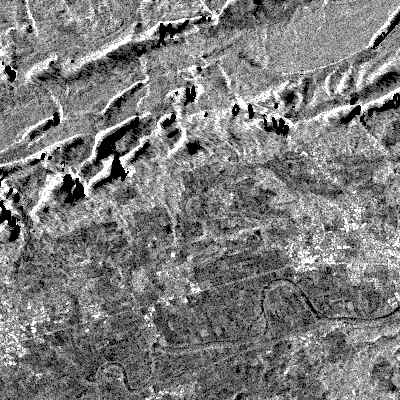
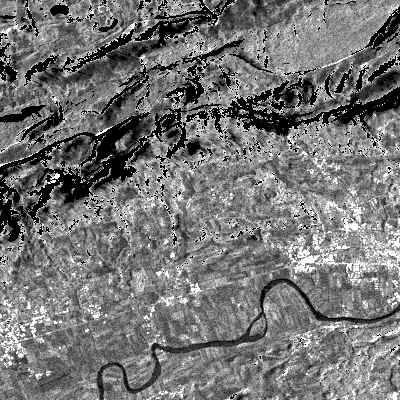
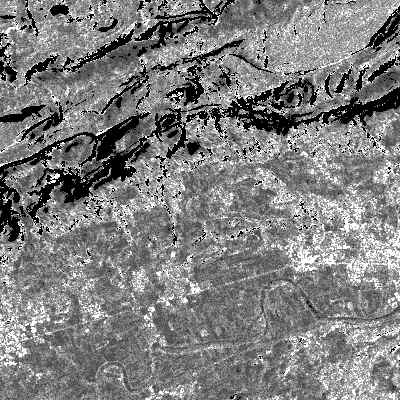
First step of preprocessing the SAR data was to perform a local incidence angle correction and to convert the SAR Digital Numbers (DN) of the pixels to backscatter coefficients, which were computed using 2x2 averages for a 25 m grid indexed by image coordinates. Figure 1 demonstrates the original DNs (left) and local incidence angles (right), while figure 2 shows the resulting backscatter coefficients (left, in db) and the results of a combination of filters for bit-errors and speckle effects (right). A local-sigma filter (5x5 pixels, 2 sigma threshold) proved to be the best compromise between speckle reduction and detail preservation. Remaining artifacts were analyzed and showed that problems induced by terrain were not completely eliminated by the local incidence procedure. Therefore a further correction algorithm was applied for a topographic normalization of the backscatter coefficients (figure 3, right).
Quality of geocoding was checked and corrected for the five employed SAR images. Image masks for all used SAR data sets were produced indicating pixels with a missing value code or incidence angles of 0°. The combination of a mask by a logical 'OR' condition resulted in a mask image common for all SAR data sets. Additionally an analysis of layover and shadow effects was performed. Layover is common in the Swiss Jura while shadowing displays only scarce occurrence.
A principal component transform (PCT) was carried out on the preprocessed and normalized multi-temporal data set. The first principal component shown in Figure 3 (left) contains 99.1% of the total variance of the five SAR images.
Finally the SAR-based data layers were included in the multi-sensorial and multi-temporal land-use classification.
 |
 |
|
Fig.1: Original DNs in the ERS-2 SAR image (left) and corresponding local incidence angles (right) for a selected area around Solothurn. |
|
 |
 |
|
Fig. 2: Backscatter coefficients (in db) retrieved from the ERS-2 SAR image (left) and results of a combination of bit-error and a local-sigma speckle filter (right) from 6. May 1998 for a selected area of the Canton Solothurn. Black areas were masked during the local incidence angle correction procedure. |
|
 |
 |
|
Fig. 3: First principal component of the multi-temporal ERS-2 data set containing all five images of backscatter coefficients (left) and the result of a topographic normalization for the backscatter coefficients of 6. May 1998 (right) for a selected area of the Canton Solothurn. Black areas were masked during the local incidence angle correction and during topographic normalization. |
|
![]()
![]()
![]()