![]()
Measurement Data
Measurement data were used for various validation studies as well as to demonstrate the relevance of the ventilation classes and to validate their spatial distribution in the study region e.g. by wind roses. Measurement data were not used for the computation of any of the spatially distributed layers (cf. phase 1 and phase 2)!!!
A relational database management system once developed for the precursor project KABA was revised and improved for the purposes of CAMPAS. The original database already contained various meteorological, climatological and air-chemistry data valid for larger parts of the North of the CAMPAS study region. It was supplemented with further data of the years 1992 to 1999 from six permanent and various temporary measurement sites of the Office for Environment of the Canton Solothurn. In addition, wind measurements at three ANETZ stations of the Meteo Swiss located in the Canton Solothurn were used. Data were delivered as ASCII files, therefore programs for data checking, conversion and import in the database were developed, followed by comprehensive testing after completion of the data base.
Data were analyzed with respect to major problems of the regional climate of Solothurn like the well known inversions in the Swiss Midlands. Inversions are regular phenomena during nights. In winter, strong inversions may last for a week or even longer. Due to a stable stratification, strong inversions inhibit vertical exchange of air masses eventually leading to an increase of the concentration of air pollutants. The situation may be additionally aggravated by locally caused phenomena like cold-air accumulation. For example, a corresponding analysis demonstrated that daily mean NO2-concentrations at the measurement site Olten, Frohheim tended to be higher during inversions than during days without inversion.
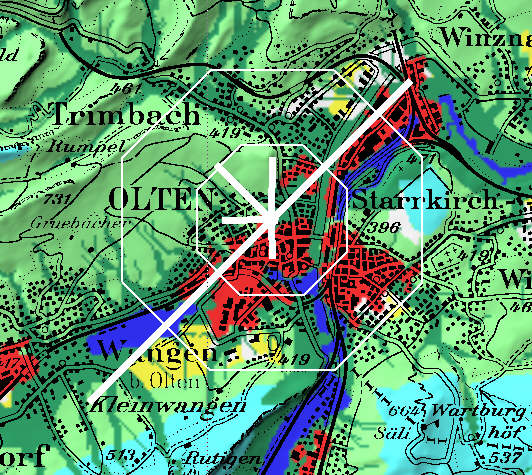
Wind roses, which are the main result of the data analysis, are displayed on top of the ventilation class layer in the climate analysis map. Although they represent point measurements, they still contain valuable information for the planners, e.g. by demonstrating spatial variations in the probability of hazardous wind speeds. Wind roses were calculated on the basis of data for the years 1992 to 1999 from nine measurement sites located in the study area. With respect to an optimal presentation on the map, wind roses show eight wind sectors and two wind speed intervals (white lines: all wind speeds; red lines: wind speeds higher than 8 m/s). Figure 1 to 3 present examples on the background of the climate analysis map.
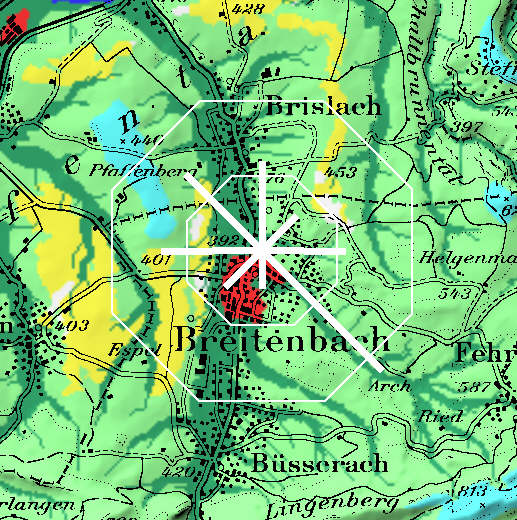 |
Fig. 1: Wind rose at Breitenbach. |
 |
|
Fig. 2: Wind rose at Olten, Frohheim. |
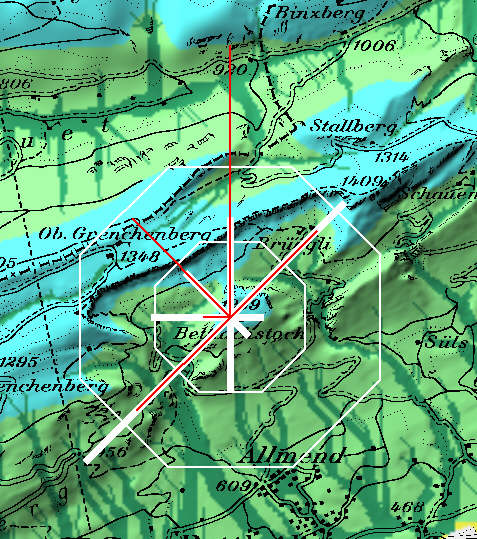 |
Fig. 3: Wind rose at Bettlachstock. |
![]()
![]()
![]()