![]()
Spatial Distribution of
Land Use Related
Structural Parameters
The land-use classification based on the defined pixel classes (PCs), is the basis for an evaluation of the consequences of land use for the local and regional climate as well as air quality. Therefore the spatial distribution of land use related physical parameters with climatic relevance was calculated. Of greatest importance in our study were the following two parameters:
![]() surface roughness composed by the sum of aerodynamic roughness length z0 and
the zero-plane displacement height d
surface roughness composed by the sum of aerodynamic roughness length z0 and
the zero-plane displacement height d
![]() total volume occupied by buildings represented by the effective height heff (building volume per unit area)
total volume occupied by buildings represented by the effective height heff (building volume per unit area)
Further possible parameters are for example: albedo, degree of density, degree of sealing..........
A structural parameter (e.g. d) is computed as weighted average of pixel class specific values for the chosen structural parameter. The fraction of each PC (see areal percentages ) is used as a weighting factor. Representative values for z0, d and heff were compiled from the database of the precursor project KABA and stored in a data table.
 |
mp is the areal
percentage of pixel class m, N ist the total number of pixel classes, md* is a representative value for structural parameter d in pixel class m |
This method not only provides eleven different values but a quasi-continuous spectrum of values resulting in an improved differentiation especially at the borders of two different land-cover types!! Additionally intra-class variations of areal types may be further analyzed (areas of the same areal types may display different values for the same structural parameter).
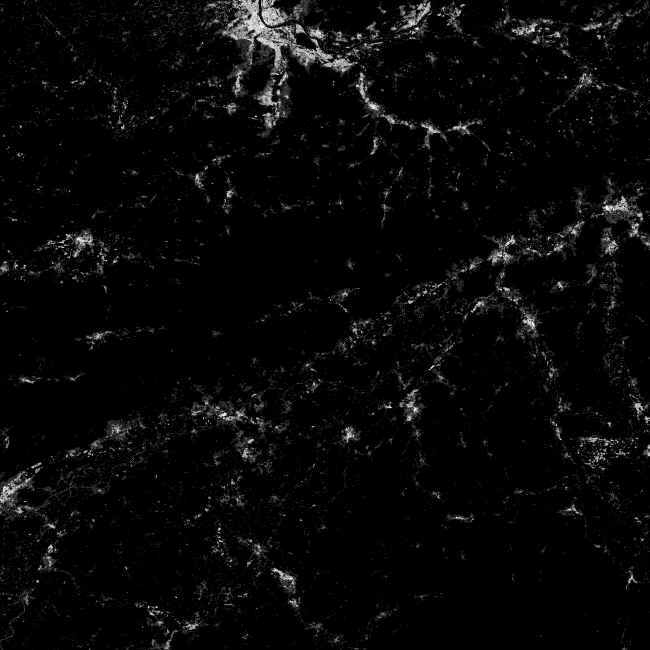
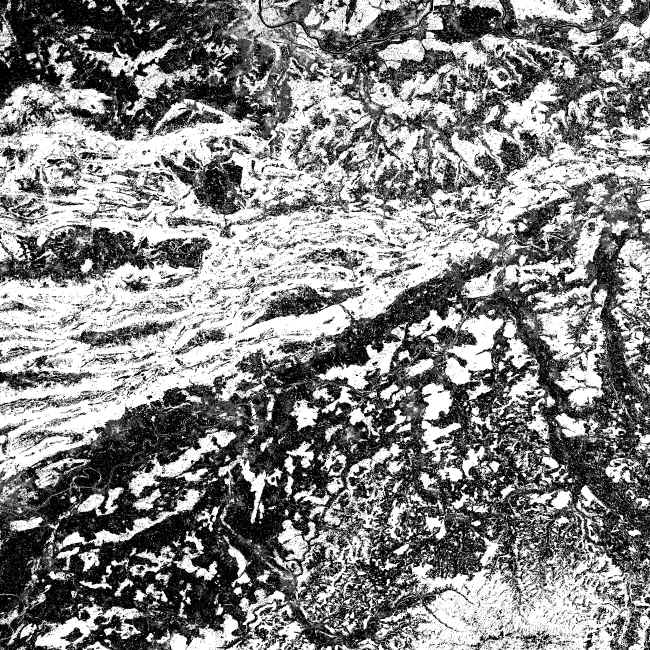
Figure 1 presents the results of the spatial distribution of the two most important structural parameters in this project. Resolution is 100 m. The spatial distribution of these structural parameters is used for the classification of the potential ventilation situations.
 |
 |
|
Fig.1: Effective building height (right) and the sum of aerodynamic roughness length and zero-plane displacement height (left). Resolution 100 m. Highest values: white, 14 m; lowest values: black, 0 m. |
|
![]()
![]()
![]()