
Kärkevagge Field Campaign 1998 (KV'98)
Kärkevagge Field Campaign 1998 (KV'98)
Based on the experience of the former campaign in 1995, the KV'98 campaign was carried
out. Again, one objective of this field campaign was to prove the theory that slushflows
are mainly released by the hydraulic pressure gradient. A second, more important objective
was to analyse the spatial and temporal variability of atmospheric and hydrologic
variables in complex terrain during the high-latitude snowmelt period.
In periods of warm air advection turbulent heat fluxes plays an important part for
snowmelt. Both sensible and latent heat flux depend strongly on air temperature and wind
velocity. In 1998, we focused our investigations on the spatial distribution of these two
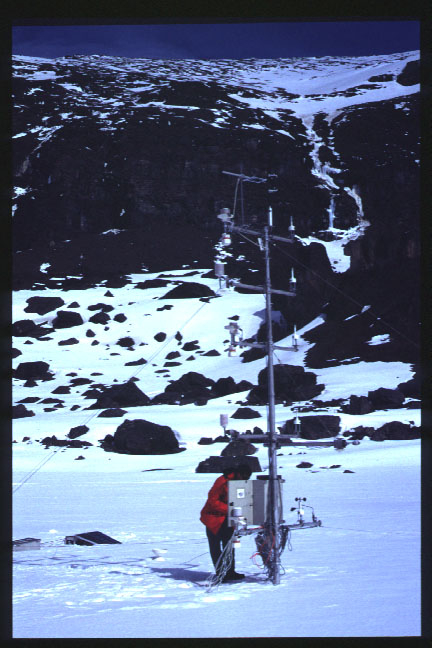
meteorlogical variables. Again, meteorological stations were installed at the valley
bottom (Valley Station) and in the Kärkerieppe cirque (Cirque Station). In the cirque,
attention was payed to install the station on a gentle moraine ridge between the two
branches of the drainage system, hoping that the station would not be destroyed in the
case of a slushflow event. Additionally, a third station called 'Slope Station' was built
up in the northern part of the Kärkerieppe cirque in a steep snow-covered slope. This
location was chosen to get information on energy balance and meltwater production at that
site, since those steep slopes contribute significantly to the meltwater accumulation in
the cirque bottom. A fourth station (Top Station) was installed on the Mt. Vassitjåkko to
measure the atmospheric processes less influenced by topography.
Click on the thumbnails to enlarge.
|
Top Station (1500 m a.s.l.) |
|||
|
Slope Station (1200 m a.s.l.) |
|||
|
Cirque Station (1000 m a.s.l.) |
|||
|
Valley Station (725 m a.s.l.) |
Air temperature, relative humidity and wind velocity were measured at
two levels, while wind direction, short- and longwave radiation fluxes and the sensible
heat flux by the eddy-covariance system were taken at one level at every station. At the
Cirque Station, two pressure transducers were additionally connected. They were installed
in the northern branch of the drainage system, which was the release zone of the slush
torrent in 1995, to get data on water saturation of the snow. At the Valley Station, three
further levels were equipped with sensors for air temperature, relative humidity and wind
velocity. Psychrometer were running at the highest, middle and lowest level. They were
installed to give comparable data to the unventilated HMP35A sensors for air temperature
and humidity.
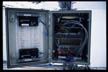
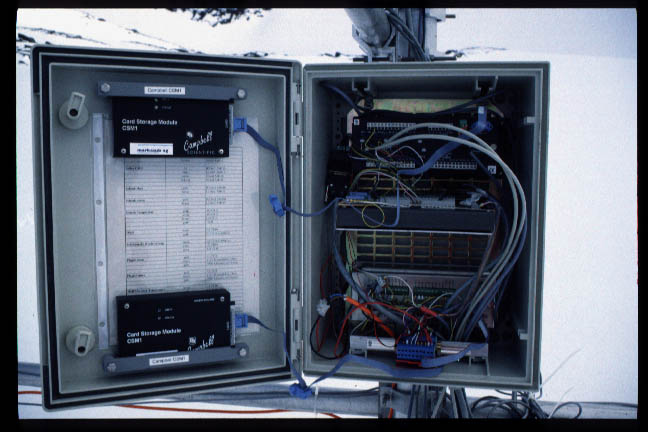
Click here to get a small or a close view inside a loggerbox. Two data loggers, storage
modules and memory cards were used. Memory of the cards varied from 1MB to 4MB and made it
possible to keep the station running for a longer time. In former campaigns we were forced
to visit each station daily to read out the data from the logger by a laptop. A telemetric
way to read out the data would be a great advantage. It would be possible to check whether
the station is running or not, and the data could be monitored online. This feature is
useful especially in mountain areas where bad weather conditions like storm, snowfall or
white-out makes it temporarily impossible to maintain a station manually.
Once started, all the stations except the Valley Station operated quite well, even during
times, when the solar panels were covered with snow. At the Valley Station, some problems
with the power supply occurred due to the high current for the ventilated psychrometres.
In addition, the particular data logger system used at that station caused data losses of
several hours.
Beside the meteorological measurements some hydrological stations
were installed in the Kärkevagge valley bottom, measuring electric conducticity, water
temperature and water level and with automatic water samplers. They were located in the
southern, upper part of the Kärkejokk, at the confluence of the Kärkerippe cirque
drainage system and the Kärkejokk, and at the northern end of the Kärkevagge.
The intensive measurement period, during which all meteorological stations were running, finshed at June 11th. All four stations should be deinstalled then. But up to that time no slushflow event was observed. One the one hand, bad weather conditions with storms and snowfall had been quite frequent during that time, which usually is the main snowmelt period. On the other hand, the snow distribution was quite different to 1995 as illustrated in the following table.
| Cirque Station | Valley Station | |
| 1995 | 3.5 m | 1.8 m |
| 1998 | 5 m | 0.4 m |
At that time the snow depth in the cirque was almost the same as at
the beginning of the campaign, but at the valley station nearly all the snow has melted.
This was a clear indication that the main snowmelt period had started delayed, but could
be more intense in the upper parts of the drainage basin due to a higher probability of
strong warm air advection compared to 'regular' years. So, all stations but the Cirque
Station were deinstalled, while this station was reconfigured to continue the
meteorological and hydrological measurements in the cirque area.
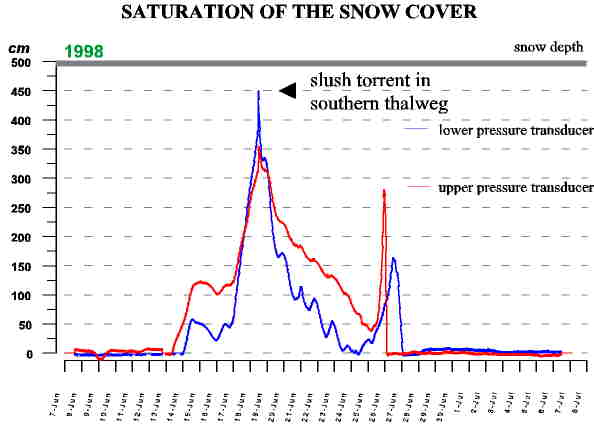
After the group from Basel left the Kärkevagge on June 12th, high
amounts of meltwater were produced. The following figure illustrates the development of a
water-saturated layer in the snow cover at the Kärkerieppe cirque. It took only a few
days until almost the total snow cover was water-saturated. On June 18th, a slush torrent
released fom the southern branch of the drainage system. Subsequently, this slush torrent
also increased the drainage capability of the snow cover in the northern branch where
pressure transducers were installed. So this area was drained effectively without a
destruction of the snow cover.
With respect to the second hydrologic event around the 26th, 27th of June, we actually do
not have a clear figure of the process chain. A secondary sharp rise of the water
saturation was measured in the northern branch. Again, no slushflow was released, since
the water level did not reach the snow surface (which was possibly less than 5 m during
that time). It seems that an intensified meltwater production occurred during weather
conditions providing a high energy input to the snow cover. But possibly, pipes may have
been developed at the snow base causing a very effective drainage of the snow cover, and
reducing or even removing the risk of a slushflow release.
Susanne Dietrich from Jena, who still was in the Kärkevagge for
further investigations, described the slush torrent as follows:
" Since two days there are high temperatures about +10°C. You can hear a continuing
roaring of water together with the whistling of the wind. At 10.45 UTC, I heard a very new
muffled roaring. I observed the cirque, but as I stood at the southern end of the
Kärkevagge, I only could watch the fan of the Kärkerieppe valley. During the next
seconds, the noise became louder and louder until I saw a big dirty wave of snow and water
sliding over the fan. A few seconds later, it was totally silent. From the beginning to
the end of the noise, it took only four to six seconds."
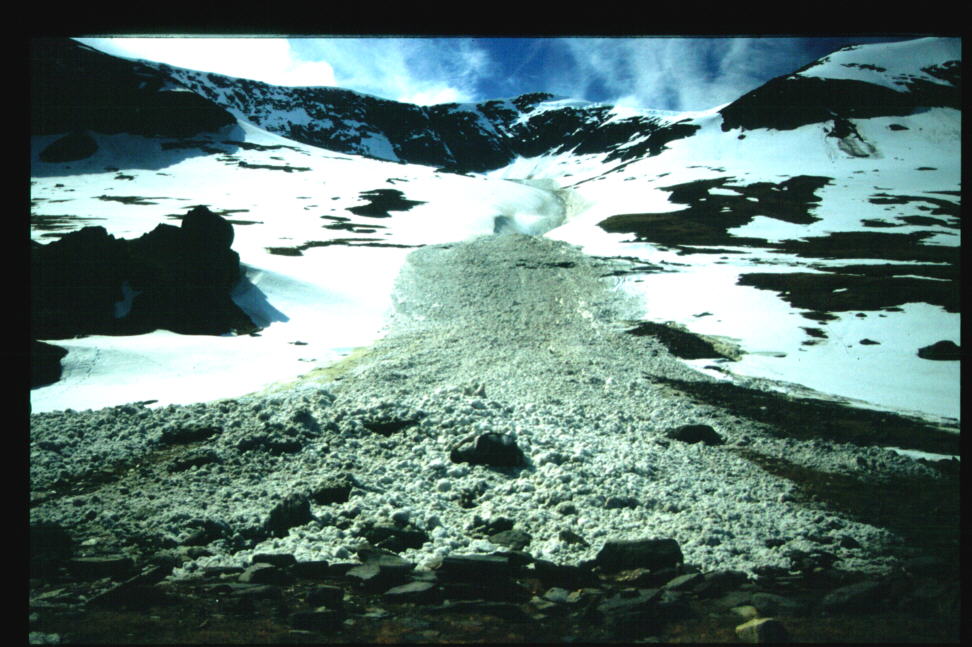 The slush torrent 1998. Click on the picture
to see a full size version (116KB).
The slush torrent 1998. Click on the picture
to see a full size version (116KB).
We want to say thank you to all persons, who had helped us to carry out this campaign. Many thanks are given to Susanne Dietrich from the University of Jena, who documented the slush torrent, M. Lundkvist and U. Clevfors from the University of Uppsala, who worked with us in the field. We extend our thanks to all members of the Abisko Scientific Research Station, who supported us gratefully. The Karlsruhe Research Center GMBH supported our campaign logistically for which we want to thank. The field campaign was financed by the Swiss National Science Foundation.
· Top
of page · MOSAIC home·
 KV home


