![]()
Phase 2: Production of Maps with Planning Guidelines
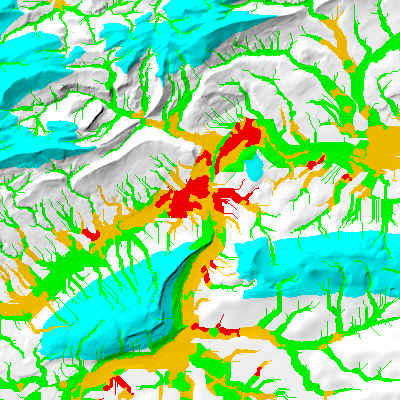
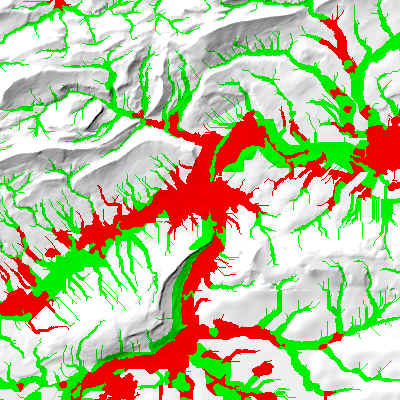
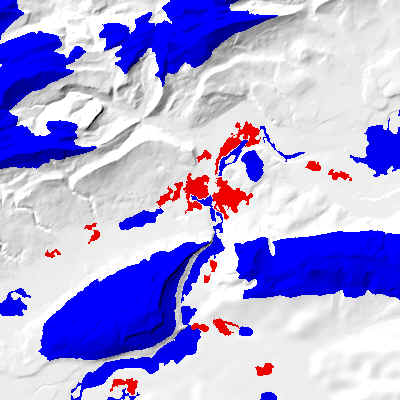
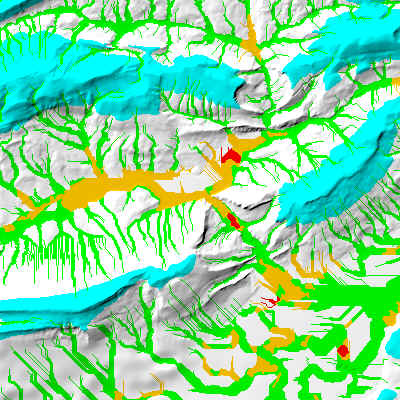
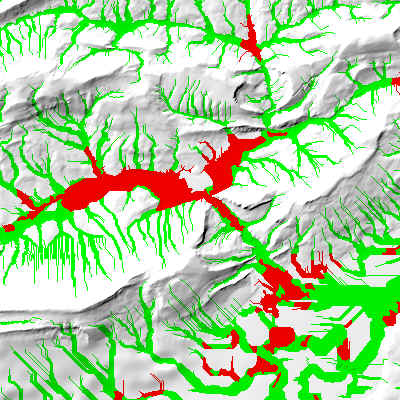
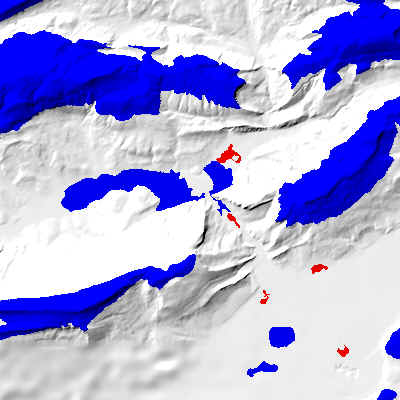
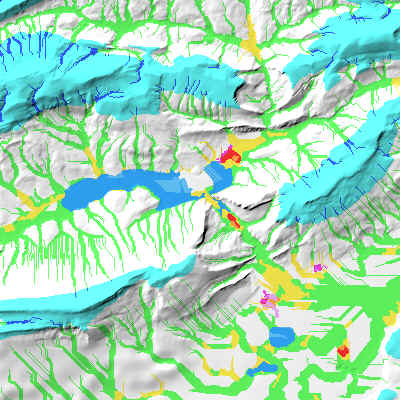
This page presents results for two areas in the study region. Figure 1 and 2 show the spatial distribution of the planning objectives (PO) for the individual problem sections as well as the combined POs of all three problem sections (corresponding colors see Table 1 and 2).
Tab. 1: Legend of the individual planning objectives.
| Color | A | Color | A | Color | B | Color | C | ||
|
|
1 | 3 | 1 | 1 | |||||
|
|
2 | 4 | 2 | 2 |
Tab. 2: Legend of the combinations of planning objectives.
| Color | A | B | C | Color | A | B | C | Color | A | B | C | Color | A | B | C |
|
|
0 | 0 | 0 | 0 | 2 | 2 | 2 | 2 | 0 | 3 | 2 | 1 | |||
|
|
0 | 2 | 0 | 1 | 1 | 0 | 2 | 2 | 2 | 4 | 0 | 2 | |||
|
|
0 | 2 | 1 | 1 | 1 | 2 | 3 | 2 | 0 |
 |
 |
 |
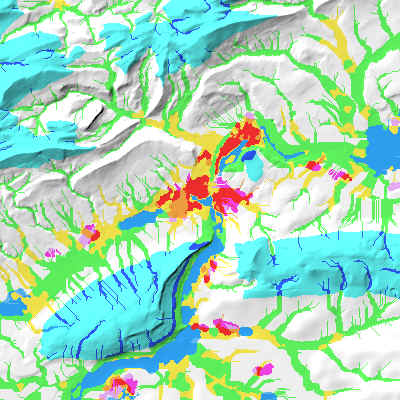 |
| Fig. 1: The city of Olten and surroundings. Problem section A 'Ventilation' (top left); B 'Air quality' (top right), C 'Thermal situation' (bottom left) and combined POs (bottom right). | |
 |
 |
 |
 |
| Fig. 2: The city of Balsthal and surroundings. Problem section A 'Ventilation' (top left); B 'Air quality' (top right), C 'Thermal situation' (bottom left) and combined POs (bottom right). | |
![]()
![]()
![]()