![]()
From Digital
Elevation Models
to a Digital Terrain Model
Several digital elevation models had to be included in the terrain model preprocessing. For the area of Canton Solothurn the Office for Regional Planning of the Canton Solothurn provided a digital vector elevation model (DEM) allowing accurate vector-raster conversion for spatial resolutions up to 25 m.
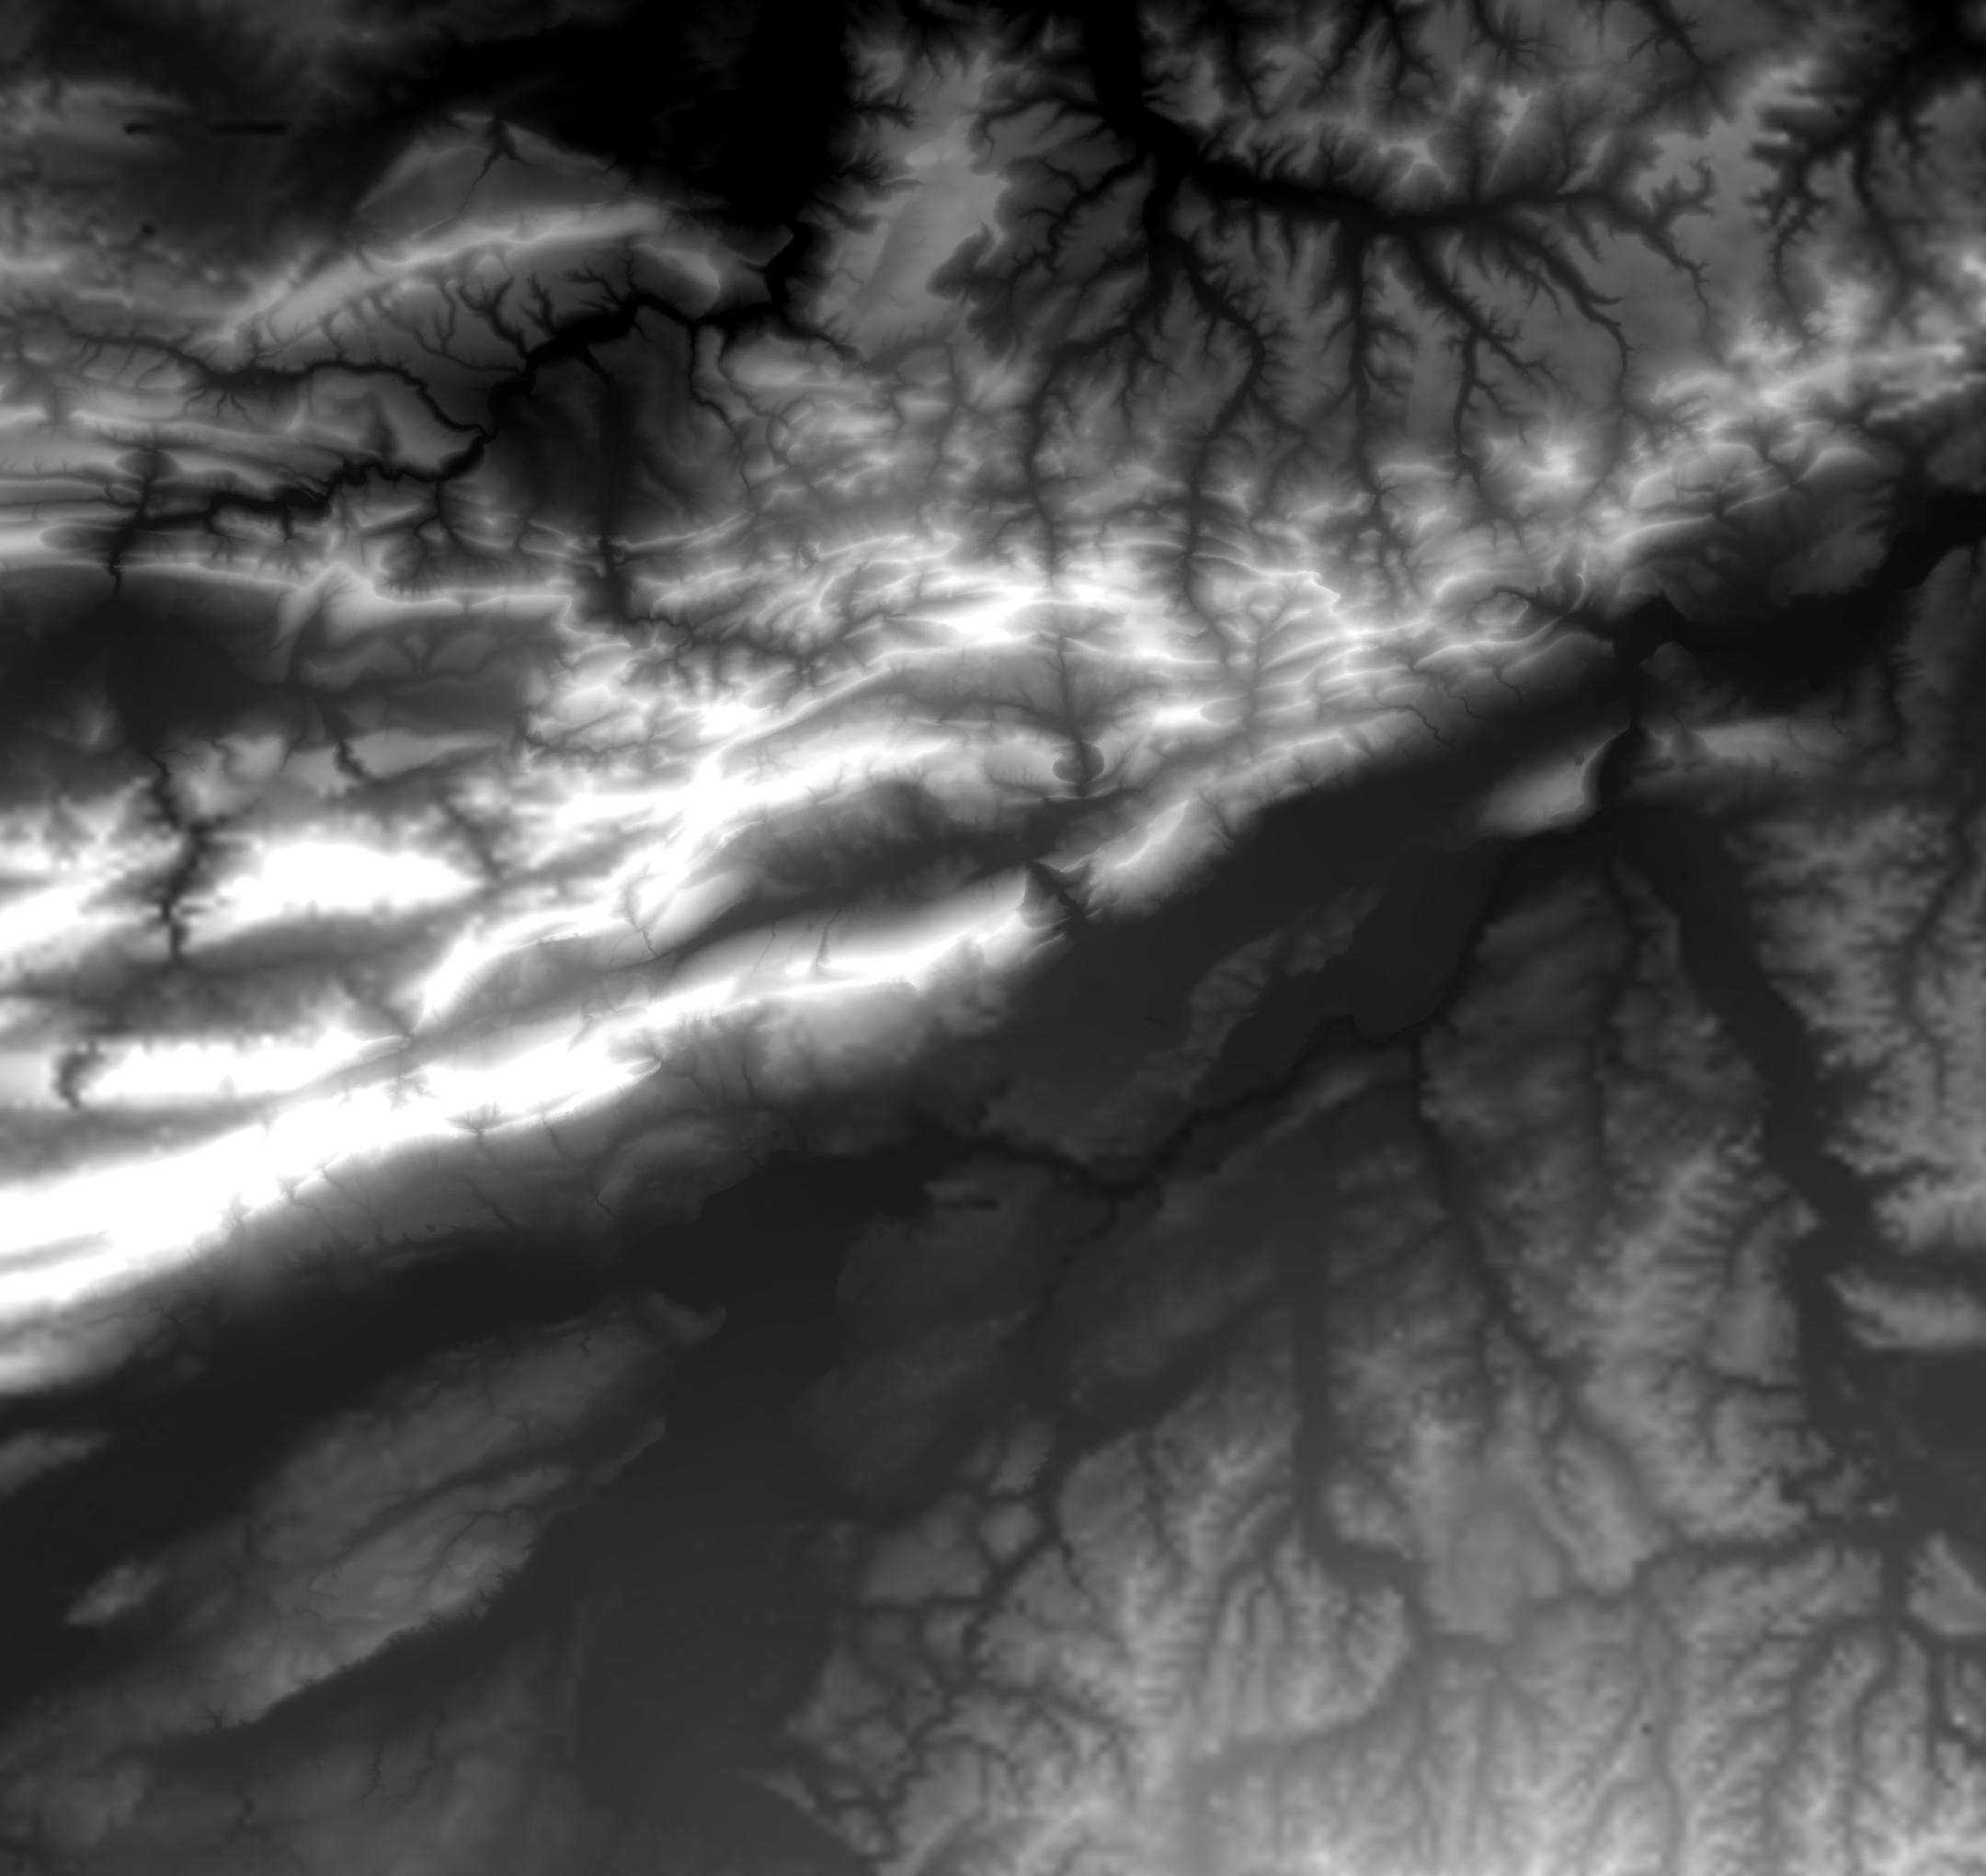
Since atmospheric processes do not end at cantonal boundaries, elevation data from the surrounding areas have to be included for climate analysis. The only DEM available for CAMPAS in the southeast is the RIMINI model (provided by the Swiss Office for Topography) with a spatial resolution of 250 m. For the north of the study site accurate DEM data of 25 m spatial resolution were generated during the KABA project. Both data sets were used for the areas uncovered by the DEM of the Canton Solothurn and also to set up the boundary values for the vector-raster conversion procedure. The conversion is based on a Delaunay triangulation. The resulting grid DEM exists in a binary format using 1 mm elevation increments. Figure 1 shows the final 25 m DEM grid from the vector-raster conversion for the study area.
|
|
Fig. 1: Resulting DEM grid from vector-raster conversion for the study area. |
The digital terrain model (DTM) consists of a DEM layer and a variety of additional topographic layers. Procedures for DTM-layer computations are fully available for a 25 m DEM. All DTM layers were comprehensively quality-checked. DTM layers used in CAMPAS are listed in the Table 1.
Tab. 1: DTM layers used in CAMPAS.
Symbol |
Variable |
Unit |
Remarks |
z |
Elevation | m a.s.l. |
DEM layer |
|
x-component of gradient | W-E direction |
|
|
y-component of gradient | S-N direction |
|
b |
Slope angle | ° | |
j |
Aspect angle | ° | N: 0°, E: 90°, S: 180°, W: 270° |
L tot |
Total curvature | m-1 | Laplace operator applied to z |
L lon |
Profile curvature | m-1 | Curvature longitudinal to gradient |
L trans |
Plan curvature | m-1 | Curvature transversal to gradient |
D zd |
Depth of topographic depressions | m | 0 m indicates no depression |
D zf |
Height of full forms like isolated hills or mountains | m | 0 m indicates no full form |
Aup |
Upslope area | m2 | |
f flow |
Flow direction of runoff | ° | 45° increment, coding as aspect angles |
rout |
Coordinates of associated outlet | m | (x,y) internally stored as pixel number |
D rout,2D |
2D-distance to associated outlet | m | horizontally measured along stream course |
D rout,3D |
3D-distance to associated outlet | m | horizontally and vertically measured along stream course |
ndb |
Drainage basin number | Internal numbering |
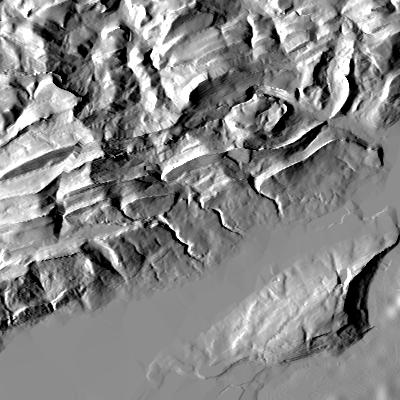
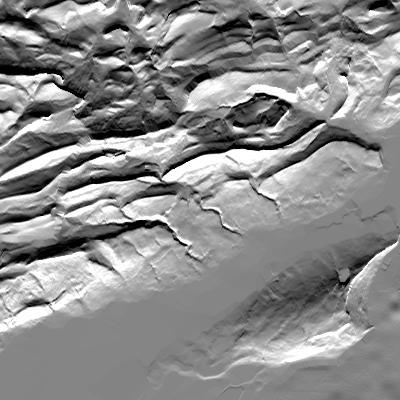
Figure 2 demonstrates both components of the gradient for an area around Olten computed from the 25 m DEM. Results of the DTM will not only be used for map shading but also for the classification of various ventilation situations describing the ventilation conditions of the study area. Despite the application of different DEM data sets the 1st derivatives displayed in Figure 2 only show a gradual decrease of accuracy in the transition zones of the different data sets.
 |
 |
|
Fig. 2: x-component (left) and y-component of the gradient of z(x,y) computed from the 25 m DEM for a selected area around the city of Olten. |
|
![]()
![]()
![]()